Using Futures & Options
Larry Martin
1. Using Technical Analysis to Help with Timing of Pricing Grains
North American grain and oilseed markets all made price lows in early September 2019. Chicago March wheat made a U$4.57 double bottom on Sept 3rd. March corn bottomed below U$3.70, soybeans at U$8.79, and canola at C$452, all around the same date.
All four then rallied, especially wheat which peaked at U$5.92½ on January 23. Several factors led to the rallies including dry weather in Brazil, Argentina and Australia; much lower winter wheat acreage in the US; expectations of much more exports to China once Trump’s trade agreement was signed; and strong edible oil prices resulting from reduced Malaysian palm oil supply. All these factors encouraged so-called hedge funds to take substantial long positions in wheat and soybeans.
Since mid-January, they have all declined in various degree because it rained in South America; Trump’s trade agreement has produced almost no new export sales; a reversal in the edible oil price trend; the outbreak of coronavirus extends fear of reduced demand; and a fairly bearish USDA new crop production forecast in January. The funds again multiplied the effects of these factors by selling off their long positions and moving to net short.
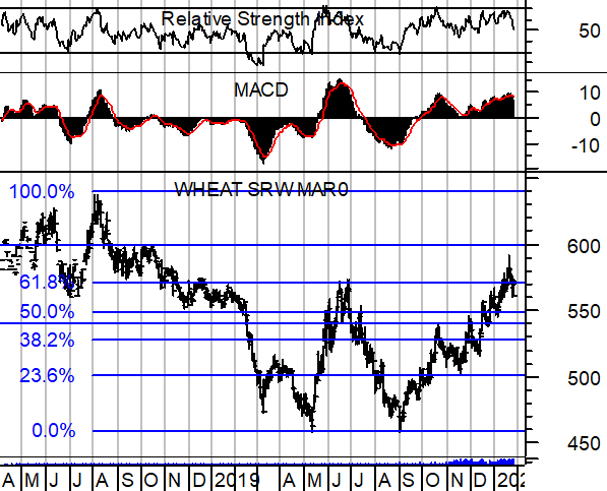
The charts for these commodities triggered sell signals just before the markets broke. Wheat (see below) hit U$5.92½ and dropped to U$5.61¾ as of this writing. The chart below shows that when it did it was just below major resistance at U$6.00 and was diverging from both the RSI and MACD. This area was a good one to either sell some wheat (paper or physical) or to place a floor price in by buying options.
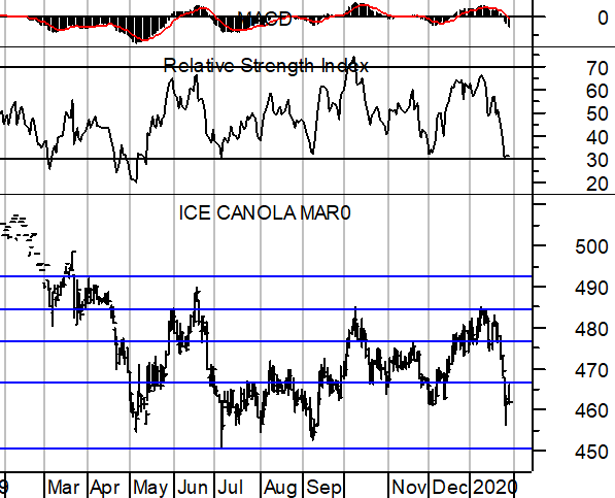
Canola has gone to resistance at C$485, the 50% retracement level, several times since April 2019. It did it again on January 10 and tried one more time on January 20. There is substantial divergence with the MACD and RSI just before the break-in price. So, just below $485 was a good place to sell paper or physical canola or to insert a floor price with options.
Knowing how to read charts, along with understanding hedging with futures, options and how futures prices relate to cash prices in developing a marketing and risk management strategy are integral parts of both AME’s on-line and face-face price risk management courses in February and March.
2. Effects of Exchange Rates on Canadian Commodity Prices
Most Canadian agricultural products are priced relative to the US market because Canadian and US products compete in each other’s markets or in the export market. The US is normally the much larger player, so US prices have a huge impact on Canada’s. Since June of 2019, the C$ has traded in a range of U$.75 - $77. Extending back to October of 2018, the range only extends to U$.74 - $.77. While variations within these ranges have some effect on Canadian commodity prices, this period of relative stability can lull one into forgetting what a risk it can be.
Looking back to 2000, we see a different picture, with the loon soaring to U$1.10 and swooning to U$.61!
What is the effect of this variation? For a bushel of grain priced at U$5, it translates to $6.67 when the loon is U$.75, C$7.14 when it is at U$.70 and C$6.25 when the loon is at U$.80. So, the different exchange rates of $.70 and $.80 is C$.89/bu. In other words, a penny on the exchange rate is worth about $.08-09 on a U$5.00 bushel.
Extending this to the full historic range since 2000 gives a difference of C$3.76/bu (!) – i.e. from $4.54/bu at $1.10 to C$8.20/bu at U$.61.
This shows the obvious, that the loon is a huge source of uncertainty. But it also shows that a rising loon is a risk for commodity sellers and an opportunity for commodity buyers and vice versa when it falls.
There are several ways to manage the risk while, in some cases, maintaining the chance of taking advantage of the opportunity. Some businesses use currency futures and options, but some incorporate over-the-counter type markets.
We address this issue, as well as the implications for basis in AME’s Price Risk Management courses on-line and face-face in February and March.
REGISTER FOR THE PRICE RISK MANAGEMENT USING FUTURES & OPTIONS